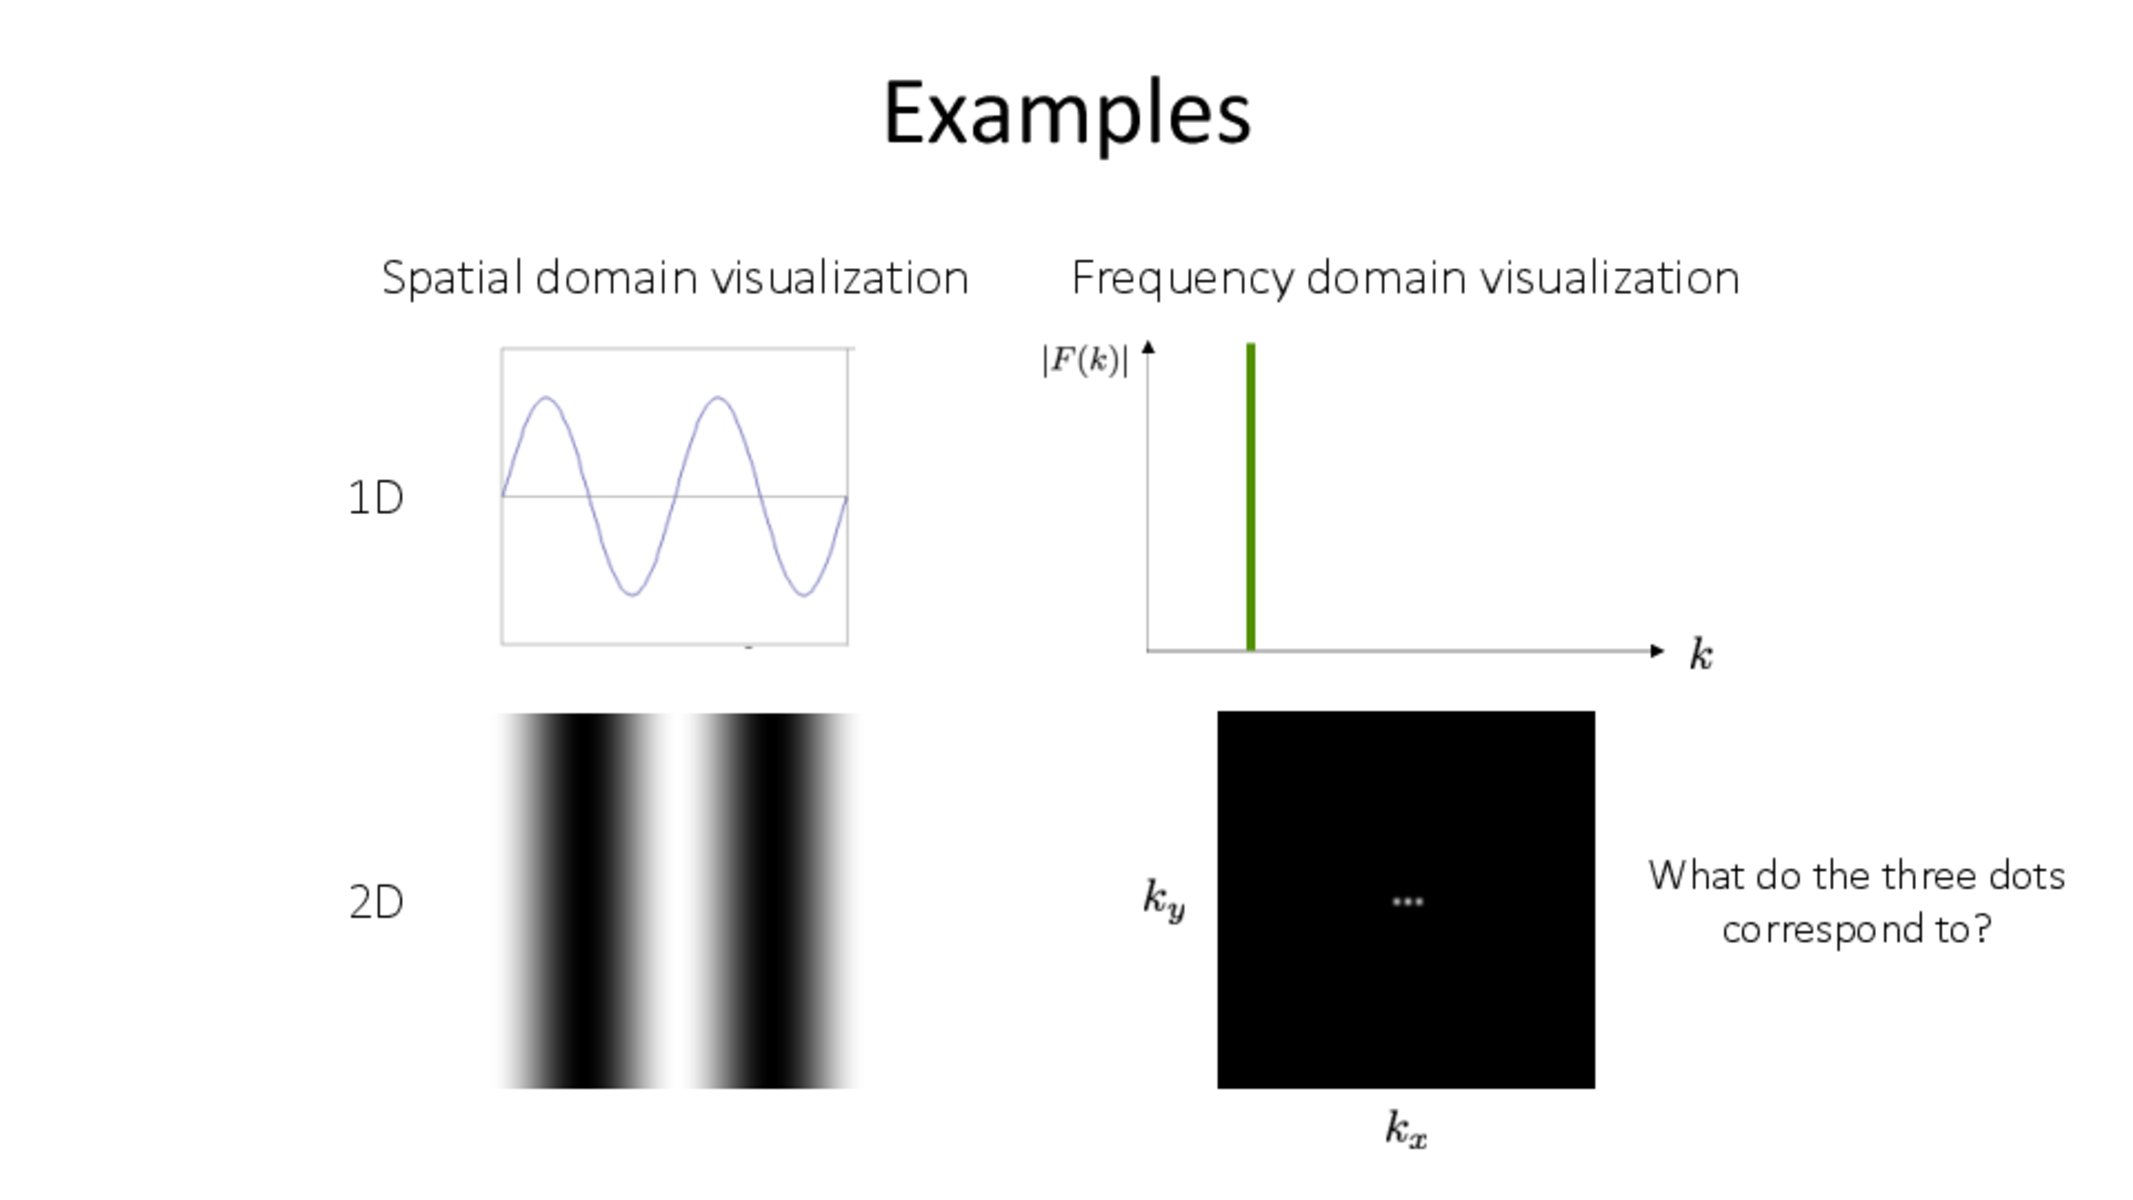
The intuitive leap from seeing two bars in 2D to then knowing that the frequency domain will be three dots is also very confusing to me. Its very hard to make the connection that what I am seeing in 2D spatial domain corresponds with the three dots in the frequency domain
mpotoole
I agree that it can be confusing at first. Definitely check out this notebook to mess around with this example a bit.
Perhaps a few equations might help here. The image $f(x,y)$ on the bottom left is the sum of three terms in this case: $f(x,y) = 0.5 e^{-2\pi i k x} + 1 + 0.5 e^{2\pi i k x}$ (corresponding to three points in the bottom-right image). Here, the frequency $k$ represents the spacing between the points shown in the bottom right.
Why three points? Well, if we expand the value of $f(x,y)$, we get the following:
$f(x,y) = 0.5(\cos(-2\pi k x)+i \sin(-2\pi k x)) + 1 + 0.5(\cos(2\pi k x)+i \sin(2\pi k x))$
$\phantom{f(x,y)} = \cos(2\pi k x) + 1$
In other words, we have a real-valued cosine oscillating from $0$ to $2$. The function $f(x,y)$ is also constant with respect to $y$, hence the "bars".
mpotoole
Also just to expand a bit.
If we had only one point (e.g., the left-most point shown in the frequency domain), the image would be $f(x,y) = 0.5e^{-2\pi i k x}$. The real part of $f$ would be a cosine, and its imaginary part would be a sine.
If we had two points (e.g., the left-most and rightmost points), the image would be $f(x,y) = 0.5e^{-2\pi i k x} + 0.5e^{2\pi i k x} = \cos(2\pi k x)$. So having the same amplitude for frequency $k$ and $-k$ ensures that the imaginary parts cancel out.
The reason for adding a third point representing the zeroth frequency is simply to make our image non-negative.
qryy
@your first reply, if we could simply f(x) down to a single cosine expression, why are there 3 different dots. If it was just one cosine, wouldn't it just be a single dot?
qryy
So given an image, there will likely be some summation of sinusoidal terms that represent it. What we are worried about isn't how to get these terms, but instead how these terms translate to the frequency domain visualization?
vvvvv
Sorry but I'm still confused about how is frequency defined in images?
mpotoole
Ah, I missed @qryy's questions here. So let's take these one by one.
Why are there 3 different dots? This slide is admittedly a bit misleading, because there are some minor differences between the 1D case and the 2D case. I provided an answer above that I think addresses this question. In short though, if you only had one dot, then your image would be given by a complex exponential, $f(x,y) = e^{-2\pi i k x}$. We need two dots to sum two complex exponential and make a cosine $f(x,y) = \cos(2\pi k x)$. The third central dot representing the zeroth frequency, $e^{-2\pi i 0 x} = 1$, makes our function non-negative $f(x,y) = \cos(2\pi k x) + 1$, by adding a constant $1$.
How do these terms translate to the frequency domain visualization? The image containing the dots is our frequency domain visualization. The value of the dots (or each point in the frequency domain) represent the magnitude of the "wave" shown in the image on the left, i.e., how big is its amplitude. The position of the dots represent the frequency/direction of the "wave" shown on the left.
How is frequency defined in images? In this case, frequency refers to how quickly the values of the image on the left goes from black to white. And more specifically, it is the value $k$ in the function $f(x,y) = e^{-2\pi i k x}$. A flat region is represented by very low frequencies, since values remain constant. An edge is represented by very high frequencies, because the values change very quickly.
Given the number of questions here, I'll consider reviewing this at the beginning of our next lecture.
mpotoole
As an additional resource, 3Blue1Brown has a nice video on this---though it only discusses the 1D case.
The intuitive leap from seeing two bars in 2D to then knowing that the frequency domain will be three dots is also very confusing to me. Its very hard to make the connection that what I am seeing in 2D spatial domain corresponds with the three dots in the frequency domain
I agree that it can be confusing at first. Definitely check out this notebook to mess around with this example a bit.
Perhaps a few equations might help here. The image $f(x,y)$ on the bottom left is the sum of three terms in this case: $f(x,y) = 0.5 e^{-2\pi i k x} + 1 + 0.5 e^{2\pi i k x}$ (corresponding to three points in the bottom-right image). Here, the frequency $k$ represents the spacing between the points shown in the bottom right.
Why three points? Well, if we expand the value of $f(x,y)$, we get the following:
$f(x,y) = 0.5(\cos(-2\pi k x)+i \sin(-2\pi k x)) + 1 + 0.5(\cos(2\pi k x)+i \sin(2\pi k x))$
$\phantom{f(x,y)} = \cos(2\pi k x) + 1$
In other words, we have a real-valued cosine oscillating from $0$ to $2$. The function $f(x,y)$ is also constant with respect to $y$, hence the "bars".
Also just to expand a bit.
If we had only one point (e.g., the left-most point shown in the frequency domain), the image would be $f(x,y) = 0.5e^{-2\pi i k x}$. The real part of $f$ would be a cosine, and its imaginary part would be a sine.
If we had two points (e.g., the left-most and rightmost points), the image would be $f(x,y) = 0.5e^{-2\pi i k x} + 0.5e^{2\pi i k x} = \cos(2\pi k x)$. So having the same amplitude for frequency $k$ and $-k$ ensures that the imaginary parts cancel out.
The reason for adding a third point representing the zeroth frequency is simply to make our image non-negative.
@your first reply, if we could simply f(x) down to a single cosine expression, why are there 3 different dots. If it was just one cosine, wouldn't it just be a single dot?
So given an image, there will likely be some summation of sinusoidal terms that represent it. What we are worried about isn't how to get these terms, but instead how these terms translate to the frequency domain visualization?
Sorry but I'm still confused about how is frequency defined in images?
Ah, I missed @qryy's questions here. So let's take these one by one.
Why are there 3 different dots? This slide is admittedly a bit misleading, because there are some minor differences between the 1D case and the 2D case. I provided an answer above that I think addresses this question. In short though, if you only had one dot, then your image would be given by a complex exponential, $f(x,y) = e^{-2\pi i k x}$. We need two dots to sum two complex exponential and make a cosine $f(x,y) = \cos(2\pi k x)$. The third central dot representing the zeroth frequency, $e^{-2\pi i 0 x} = 1$, makes our function non-negative $f(x,y) = \cos(2\pi k x) + 1$, by adding a constant $1$.
How do these terms translate to the frequency domain visualization? The image containing the dots is our frequency domain visualization. The value of the dots (or each point in the frequency domain) represent the magnitude of the "wave" shown in the image on the left, i.e., how big is its amplitude. The position of the dots represent the frequency/direction of the "wave" shown on the left.
How is frequency defined in images? In this case, frequency refers to how quickly the values of the image on the left goes from black to white. And more specifically, it is the value $k$ in the function $f(x,y) = e^{-2\pi i k x}$. A flat region is represented by very low frequencies, since values remain constant. An edge is represented by very high frequencies, because the values change very quickly.
Given the number of questions here, I'll consider reviewing this at the beginning of our next lecture.
As an additional resource, 3Blue1Brown has a nice video on this---though it only discusses the 1D case.