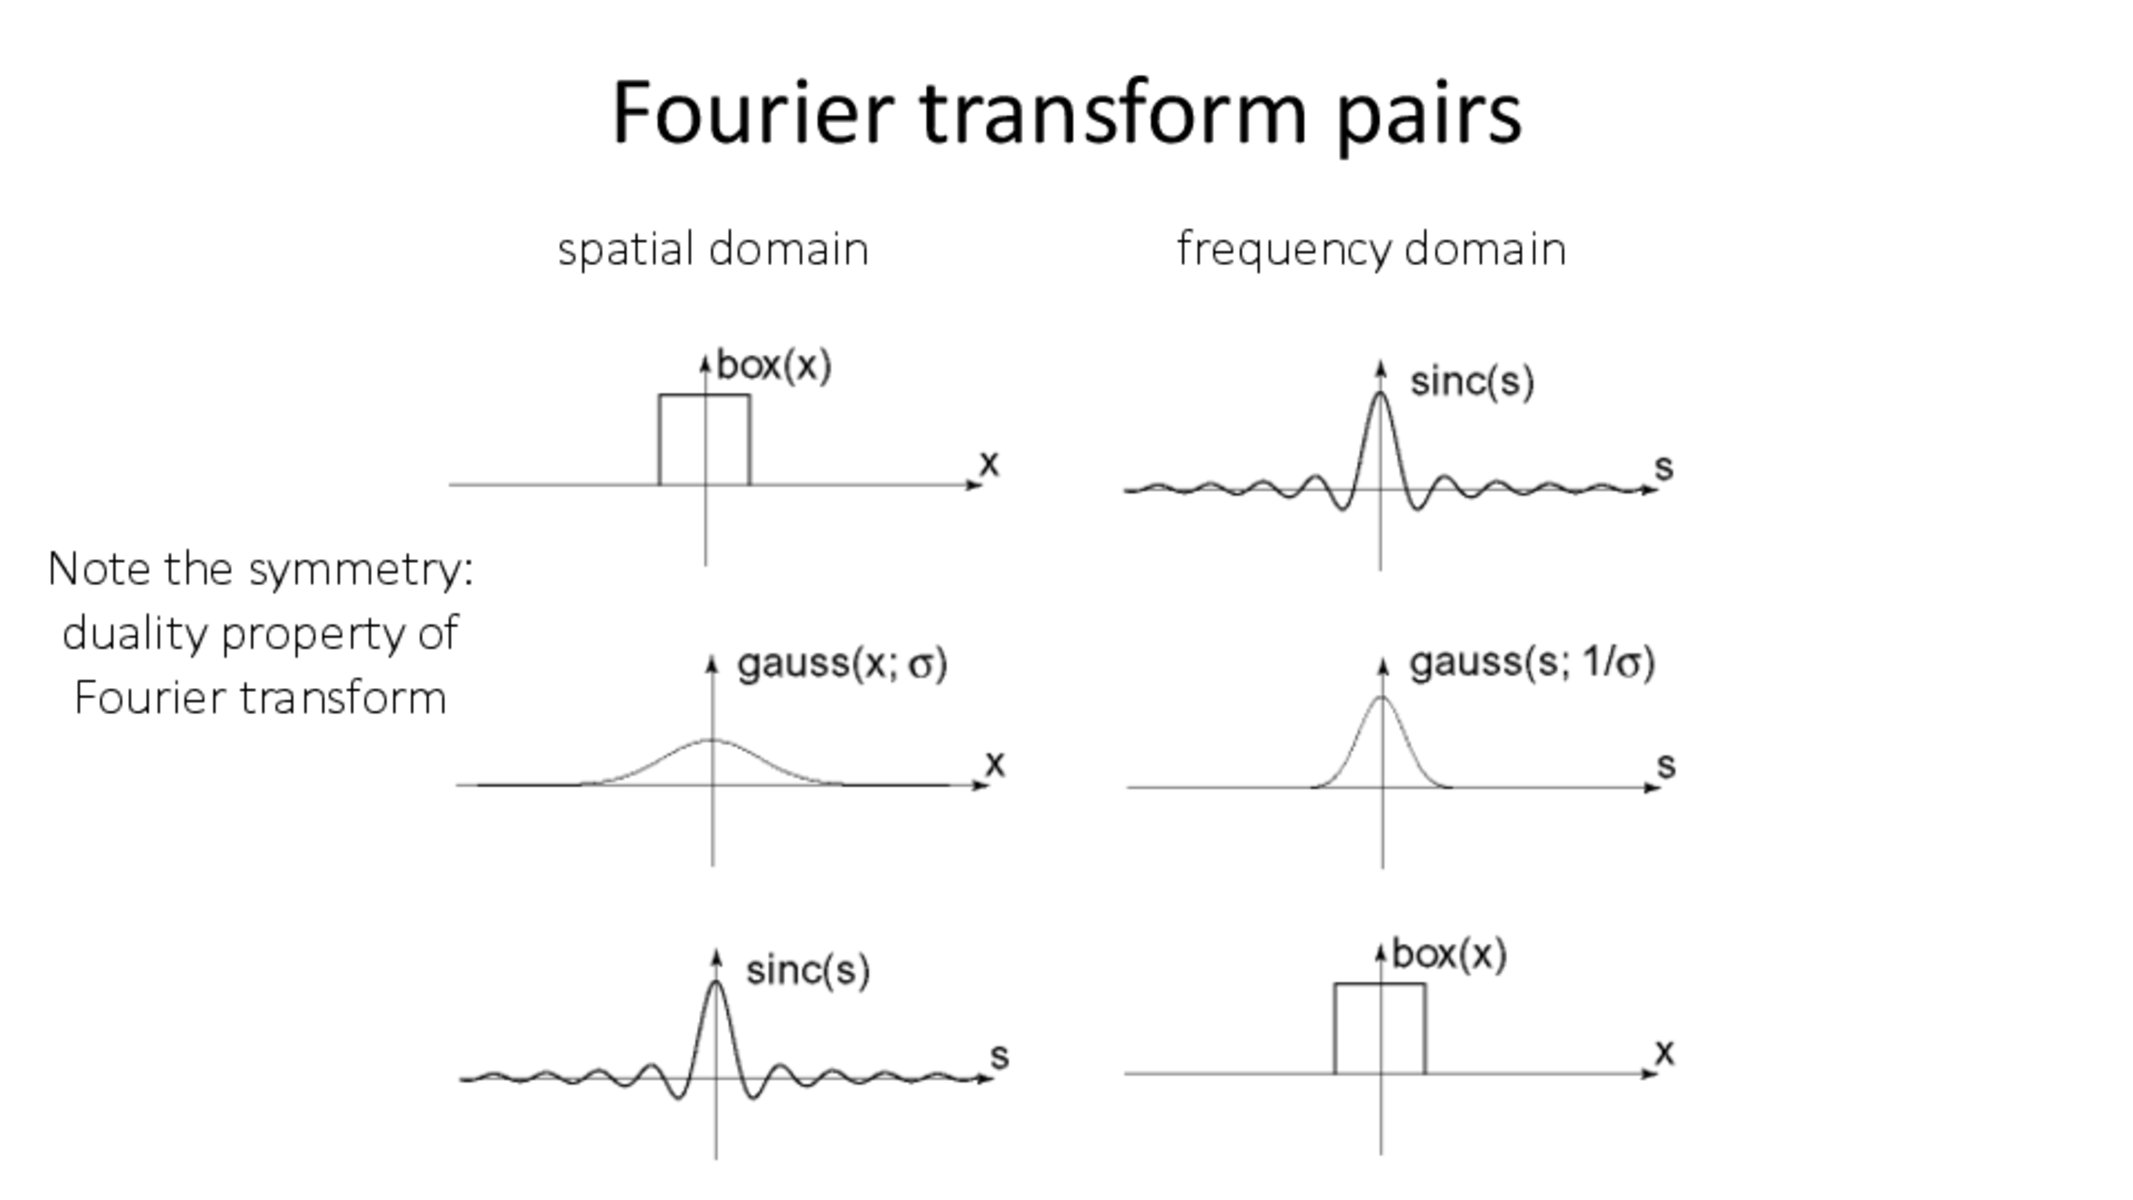
How does the box in spatial domain translate to the frequency domain representation? Is the box similar to the box-like lines we saw earlier where it is the infinite sum of sine waves? If it is an infinite sum of sine waves, we saw earlier that it looks like a an exponential curve that slow goes towards 0 as the frequency increases; why does this frequency domain look different?
Also previously the spatial domains were 2d but the frequency domains only showed amplitude vs positive frequency; why is there now a negative axis for frequency with these?
mpotoole
@qryy As you stated here, the box is the result of a sum of sine waves. It is however not the same signal that is shown on this slide, which is what I think you are referring to here. The difference is that slide 83 involves a periodic "box" function (a square wave), whereas the box here only appears once. Therefore, their spectrums will be different.
In all cases (both 1D and 2D), there is a negative axis for the frequencies. For real signals though, it's just a copy of the positive axis (so sometimes we just don't visualize it). In the case of all the 2D examples however (e.g., this slide), we show the full spectrum. The center of the image represents the zeroth frequency.
Btw, there's a demo showing off a 2D version of this slide here. The demo shows the spectrum of 2D box and Gaussian functions.
How does the box in spatial domain translate to the frequency domain representation? Is the box similar to the box-like lines we saw earlier where it is the infinite sum of sine waves? If it is an infinite sum of sine waves, we saw earlier that it looks like a an exponential curve that slow goes towards 0 as the frequency increases; why does this frequency domain look different?
Also previously the spatial domains were 2d but the frequency domains only showed amplitude vs positive frequency; why is there now a negative axis for frequency with these?
@qryy As you stated here, the box is the result of a sum of sine waves. It is however not the same signal that is shown on this slide, which is what I think you are referring to here. The difference is that slide 83 involves a periodic "box" function (a square wave), whereas the box here only appears once. Therefore, their spectrums will be different.
In all cases (both 1D and 2D), there is a negative axis for the frequencies. For real signals though, it's just a copy of the positive axis (so sometimes we just don't visualize it). In the case of all the 2D examples however (e.g., this slide), we show the full spectrum. The center of the image represents the zeroth frequency.
Btw, there's a demo showing off a 2D version of this slide here. The demo shows the spectrum of 2D box and Gaussian functions.