I'm still a bit confused about the meaning of the dots. I know they are just like spikes, but I'm not sure how amplitude is related to the dots. Thank you.
motoole2
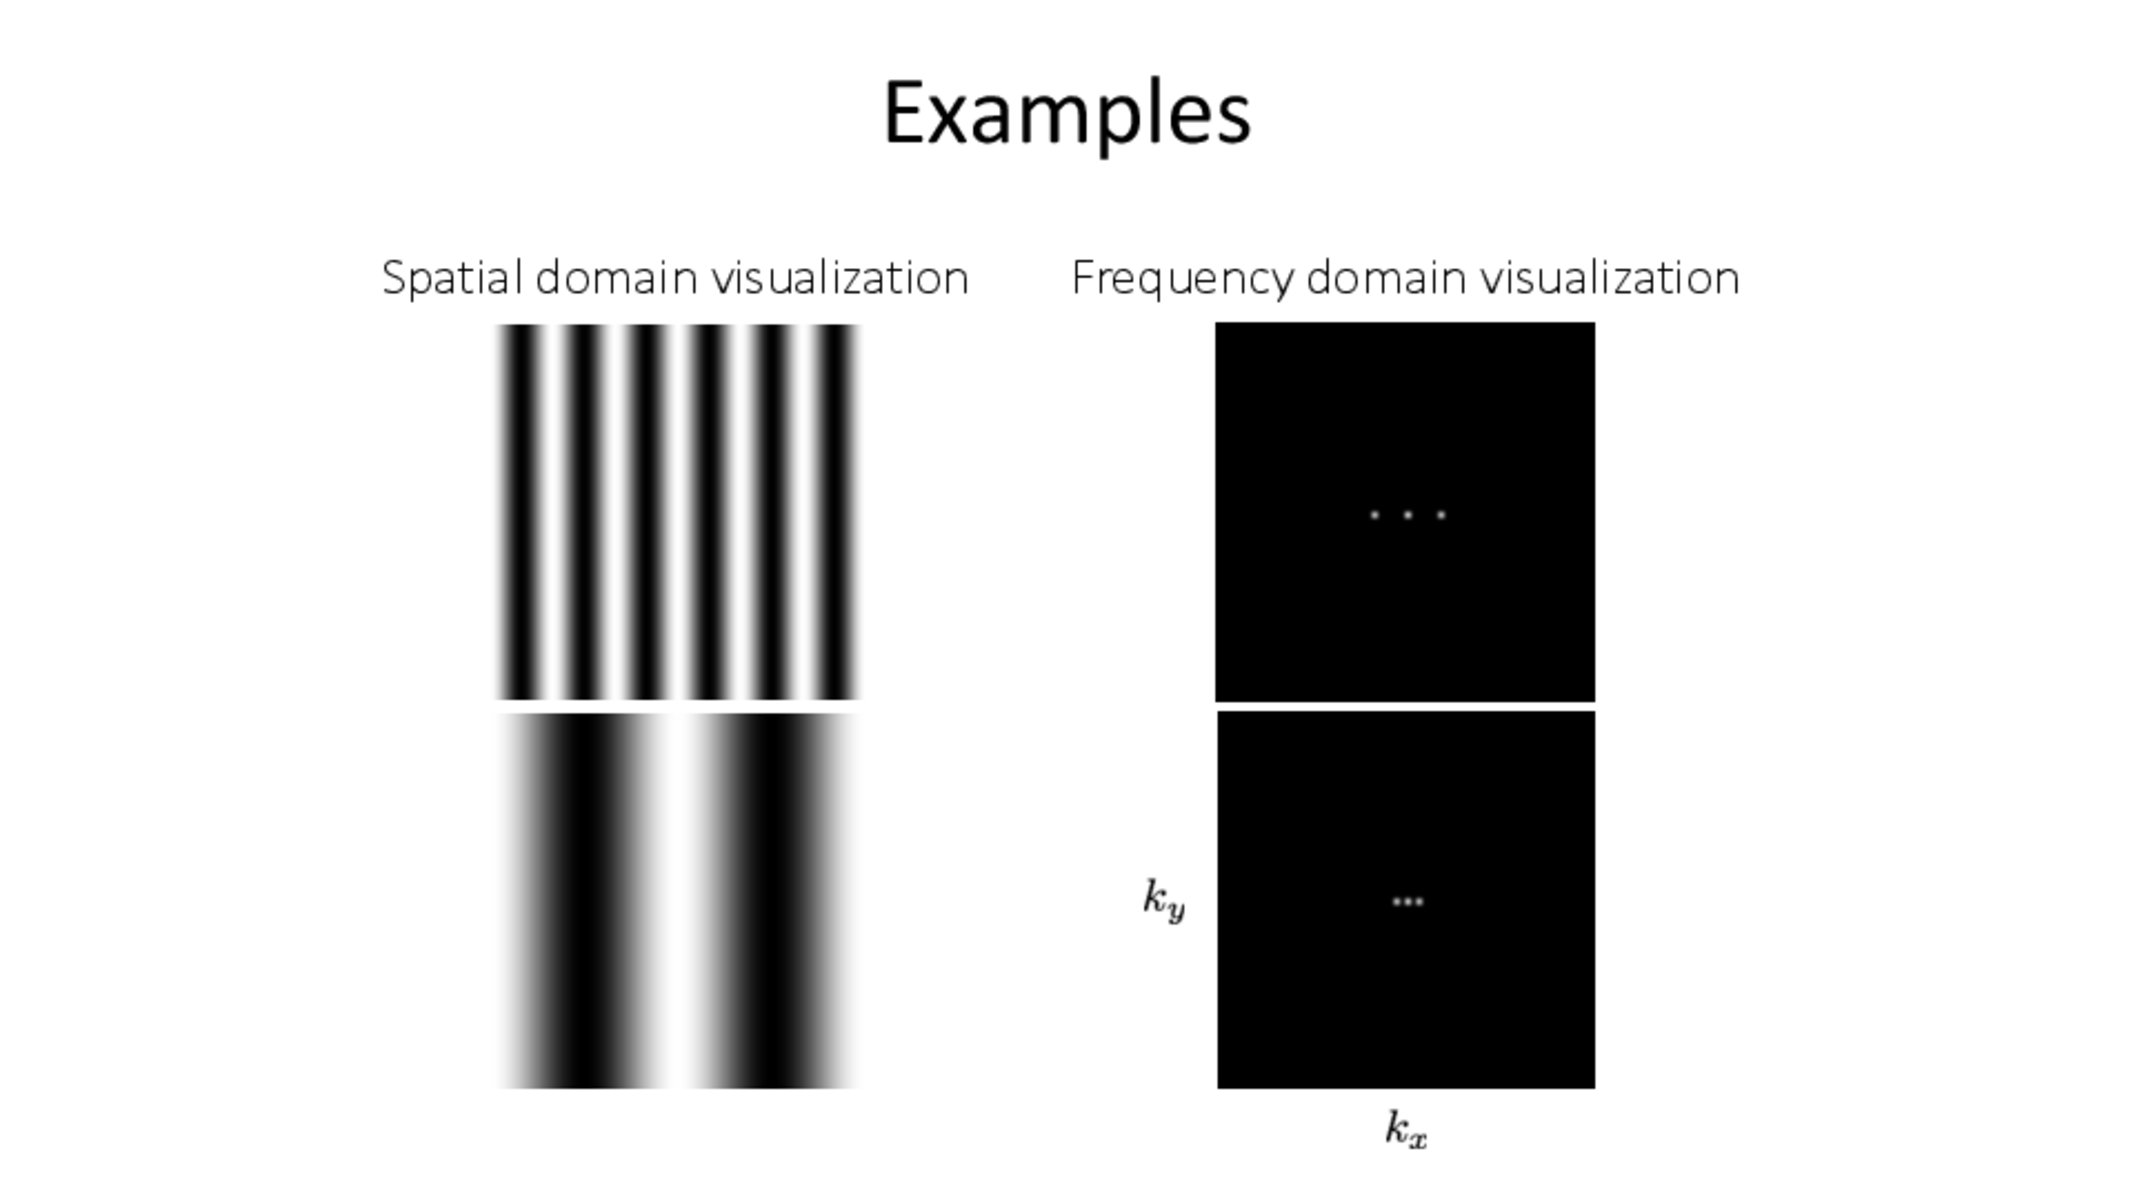
It definitely can get a little confusing. These images can be visualized as a 3D surface, where the "white" and "black" pixel values represent the height of that surface. If you were to do this, the images on the left would look like a sinusoidal wave.
The position of the dots corresponds to the frequency and direction of that sinusoidal pattern, and the pixel value at the dot represents the amplitude of the sinusoid pattern. For example, if we were to double the pixel values in the left images, this would result in doubling the pixels in the right image.
There are two links, one to a notebook and another to an interactive demo, that talks a little more about Fourier transforms in the notebook tab. I suggest taking a look at this if you're interested! We'll also revisit this in the next lecture (Lecture 4).
Hi,
I'm still a bit confused about the meaning of the dots. I know they are just like spikes, but I'm not sure how amplitude is related to the dots. Thank you.
It definitely can get a little confusing. These images can be visualized as a 3D surface, where the "white" and "black" pixel values represent the height of that surface. If you were to do this, the images on the left would look like a sinusoidal wave.
The position of the dots corresponds to the frequency and direction of that sinusoidal pattern, and the pixel value at the dot represents the amplitude of the sinusoid pattern. For example, if we were to double the pixel values in the left images, this would result in doubling the pixels in the right image.
There are two links, one to a notebook and another to an interactive demo, that talks a little more about Fourier transforms in the notebook tab. I suggest taking a look at this if you're interested! We'll also revisit this in the next lecture (Lecture 4).