I wonder how we should deal with negative outputs after applying these filters. I think that indicates that we have a negative derivative but how could we output that as a pixel?
motoole2
Great question. Suppose that you have negative values that range from -1 to 1. How do we display these to a screen?
One approach involves mapping the values to the range $[0,1]$. For example, for any pixel value $x\in [-1,1]$, we can choose to display $\frac{x+1}{2}$. That way, a value of -1 displays as black (0), a value of 1 displays as white (1), and a value of 0 displays as grey (0.5).
kgeng
Go it. Thank you!
zebra25
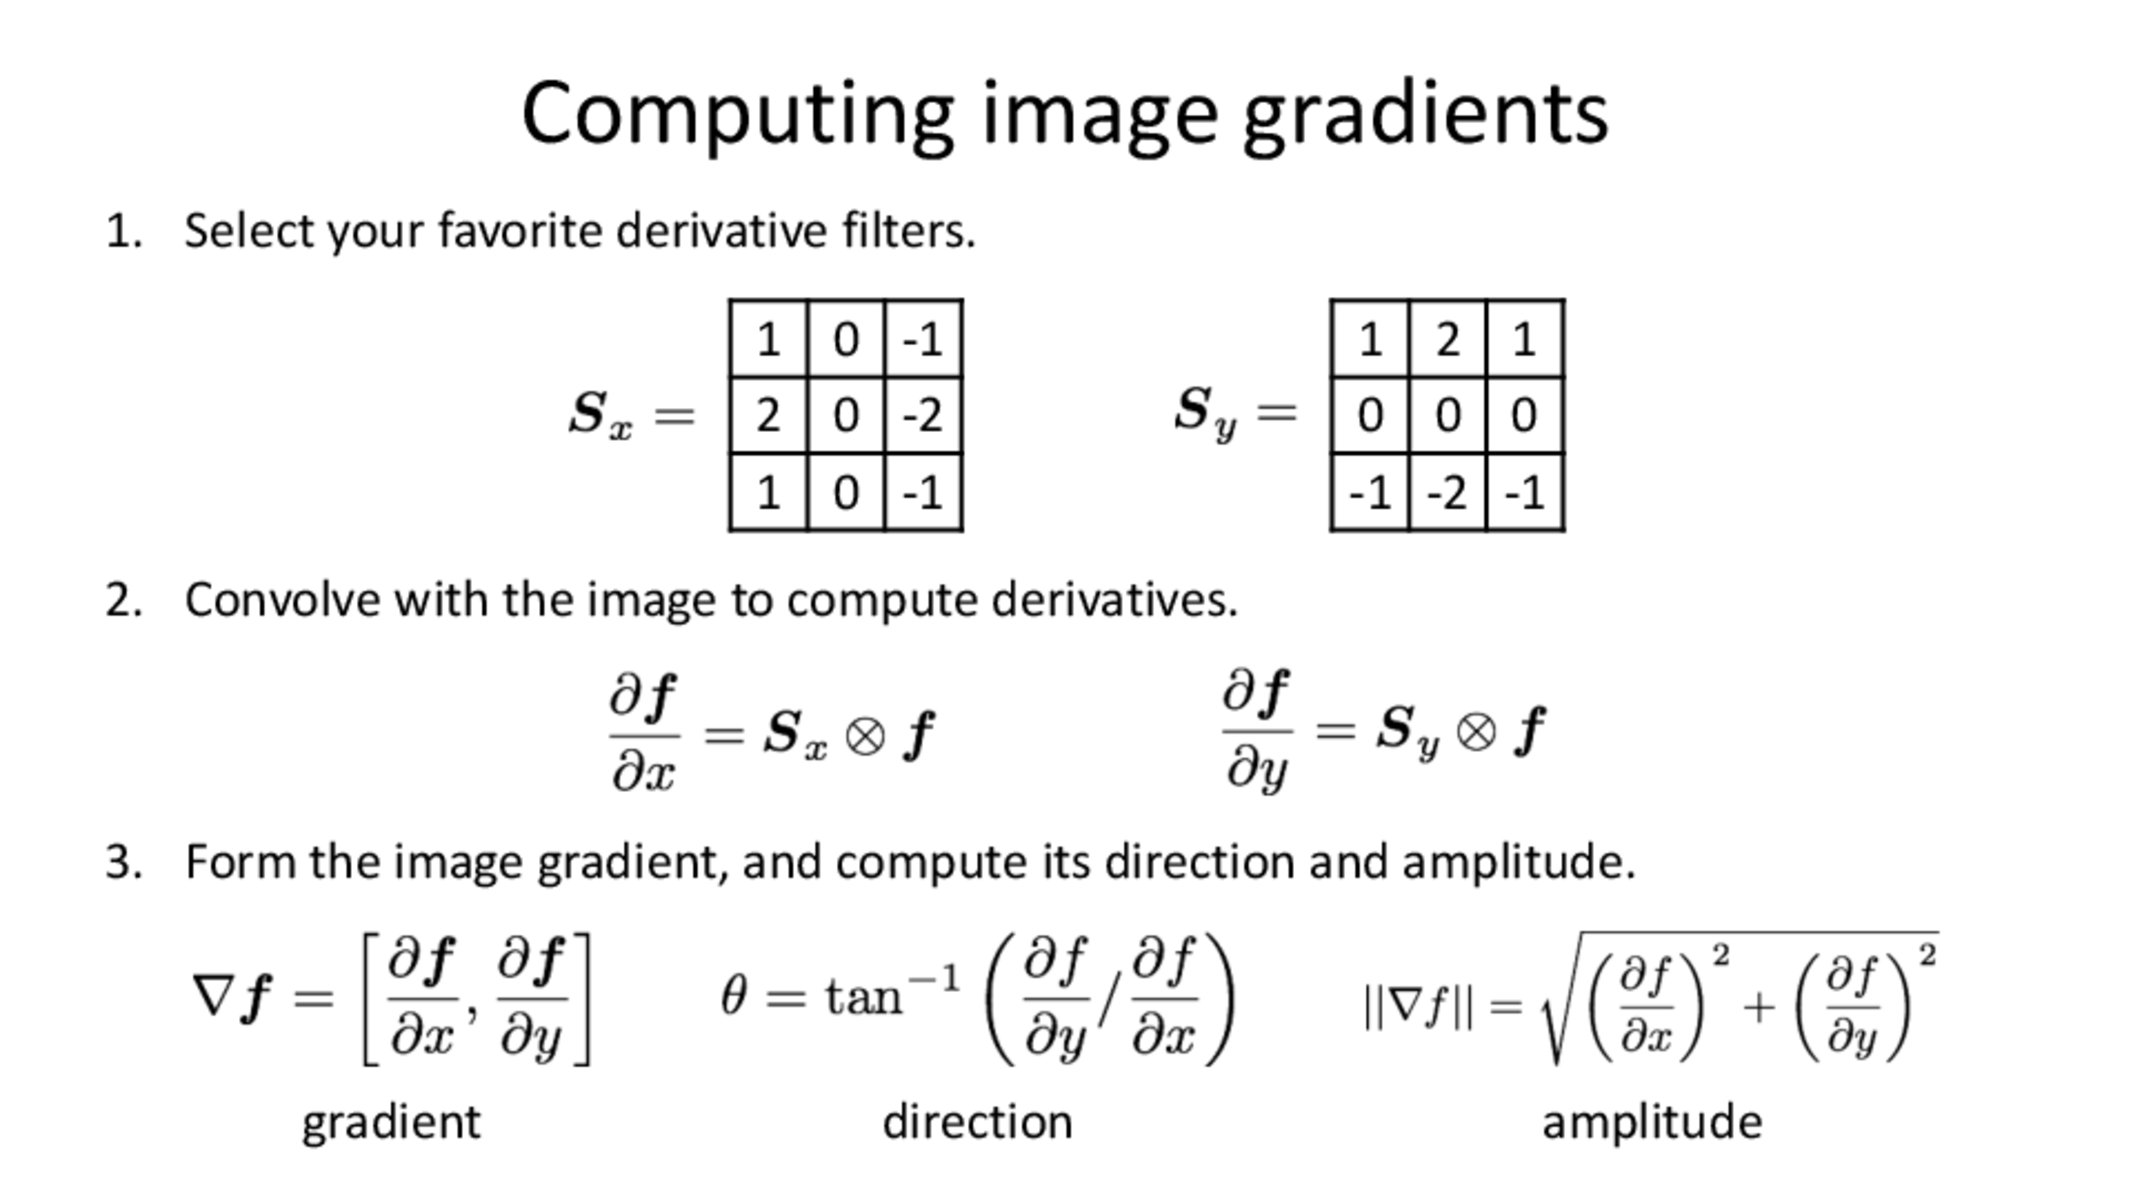
I was wondering why the the initial filter selection makes sense. While the slide says to pick derivative filters, these filters are the horizontal and vertical sobel filters, which are derivative filters combined with gaussian blur filters.
Mathematically, why does this measure the value of interest, why wouldn't we just use the simple derivative filters for their respective directions?
motoole2
What is meant by simple derivative filter? Perhaps the thought is to use a vector [-1,1]. This is certainly an option, but I would argue that the Sobel filters might offer a couple of advantages. First, this is a odd-shaped filter, centered around the point of interest. If I use an even-sized filter (e.g., [-1,1]), it's unclear where to store the gradient. Second, the Gaussian blurring in the orthogonal direction has the advantage of smoothing the image a bit, reducing noise. This makes the derivative filter operation a little less sensitive to noise in the images.
Hi,
I wonder how we should deal with negative outputs after applying these filters. I think that indicates that we have a negative derivative but how could we output that as a pixel?
Great question. Suppose that you have negative values that range from -1 to 1. How do we display these to a screen?
One approach involves mapping the values to the range $[0,1]$. For example, for any pixel value $x\in [-1,1]$, we can choose to display $\frac{x+1}{2}$. That way, a value of -1 displays as black (0), a value of 1 displays as white (1), and a value of 0 displays as grey (0.5).
Go it. Thank you!
I was wondering why the the initial filter selection makes sense. While the slide says to pick derivative filters, these filters are the horizontal and vertical sobel filters, which are derivative filters combined with gaussian blur filters.
Mathematically, why does this measure the value of interest, why wouldn't we just use the simple derivative filters for their respective directions?
What is meant by simple derivative filter? Perhaps the thought is to use a vector [-1,1]. This is certainly an option, but I would argue that the Sobel filters might offer a couple of advantages. First, this is a odd-shaped filter, centered around the point of interest. If I use an even-sized filter (e.g., [-1,1]), it's unclear where to store the gradient. Second, the Gaussian blurring in the orthogonal direction has the advantage of smoothing the image a bit, reducing noise. This makes the derivative filter operation a little less sensitive to noise in the images.